

Features / Reports and dashboards
Reports
Answers, not spreadsheets
Are we keeping up? What are repairs costing at each store? Who's swamped? Build a report in a few clicks or start from a dashboard that builds itself.
Free during the pilot
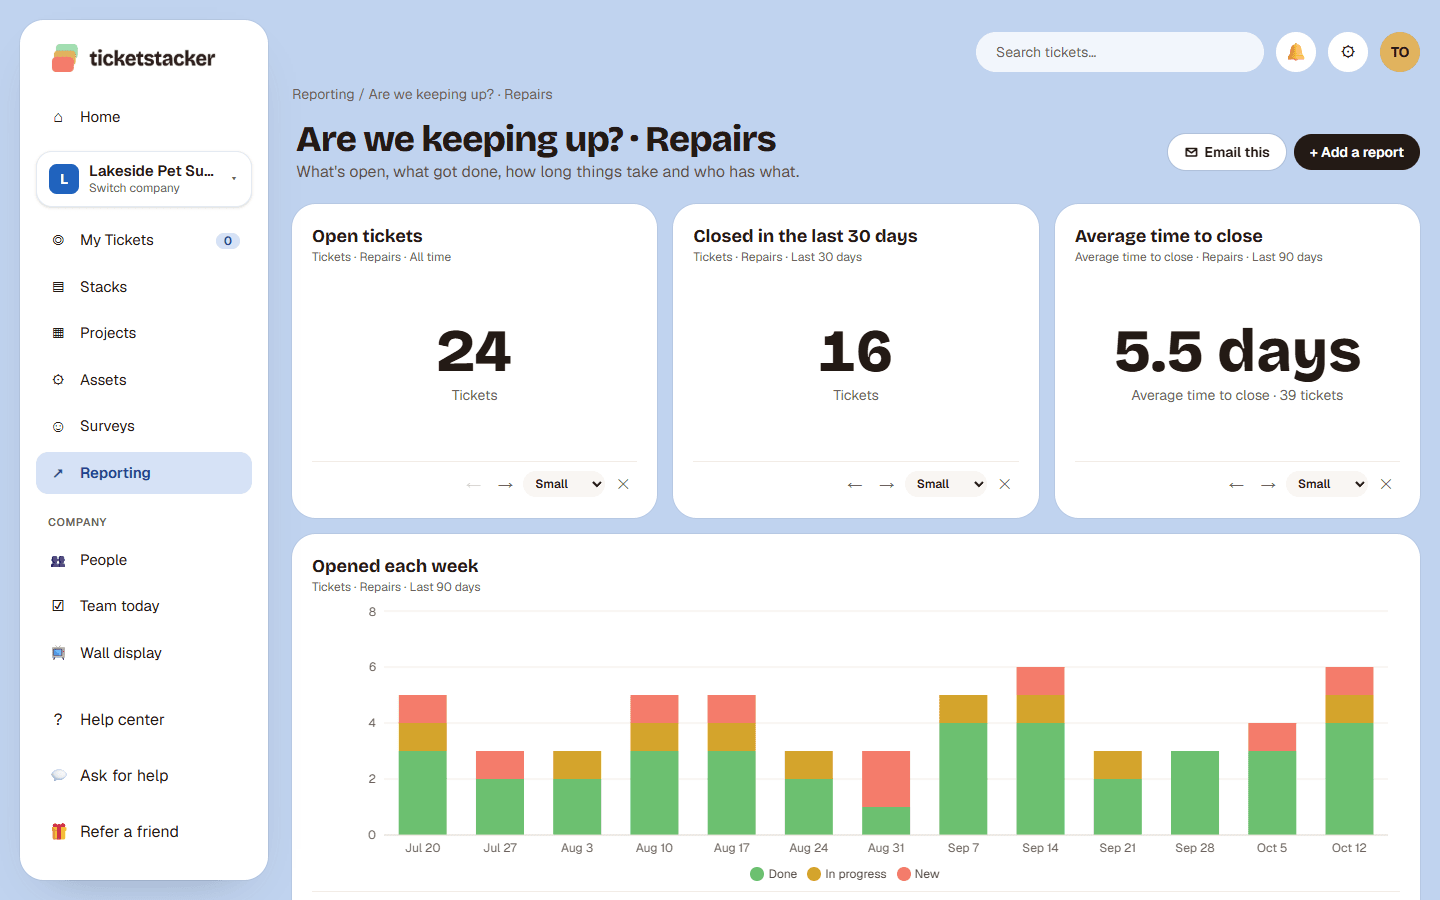
What you get
Count anything
Tickets, average time to close, or the total or average of any cost or number field.
Group and split it
By week or month, status, owner, store or any choice field, with a second grouping as colors.
Bars, lines, donuts, tables
Pick how to draw it. Charts use your company's brand colors.
Dashboards from templates
Are we keeping up, Costs by store, Team workload, Happiness (NPS) and more, built to fit your stack.
Private stays private
Each person's numbers only count the tickets they're allowed to see.
Look back and email it
Keep snapshots to see a report as it was, and email reports to managers on a schedule.
Report snapshots and scheduled report emails are part of our paid plans. Pilot companies can ask us to turn them on.
Questions
Who can build reports?+
Company Admins and anyone who owns or manages a stack. Everyone can open saved reports.
Can I email a report every Monday?+
Yes, on paid plans. Each person's email shows their own numbers, with the charts as pictures.
Can I see last quarter's numbers as they were then?+
Yes, with snapshots (paid plans): daily, weekly or monthly.
See how it works, step by step
- Help articleReportsBuild your own reports with charts, or use the built-in Overview: opened vs closed, totals, time in each step and what's gone quiet.
- How-to guide · 10 minutes a weekA 10-minute weekly reviewA short Monday routine with your reports that catches stuck work early and shows where your process needs a tweak.
- Help articleLocationsAdd your stores, offices or sites with a shared email and a manager, then route tickets and emails to them.
Goes well with
- Your own fields, steps and rulesStacks with the fields, steps, rules and automatic emails each kind of work needs.
- Surveys and NPSAsk the customers you've just served, or your team, with your Net Promoter Score worked out for you.
- Smart import from spreadsheetsDrop in your Google Sheet or Excel file. AI sets up the stack and brings every row over.
Try it with your own requests
Free while we build TicketStacker with a small group of businesses.